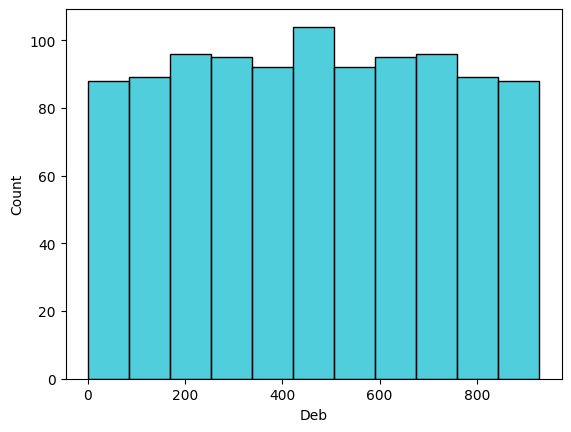
Deb’s Feasibility Rule Ranking Distribution (distr_Deb)
import math

from pyxla import distr_Deb, distr_Par, distr_f, distr_v
from pyxla.util import load_data, load_sample
from pyxla.sampling import HilbertCurveSampler
sphere_sample = {
    "name": "Sphere",
    "X": HilbertCurveSampler(sample_size=100, dim=1, l_bound=-5, u_bound=5, seed=42),
    "F": lambda x: x**2,
    "V": [lambda x: x**2 - 2, lambda x: 8 * math.sin(20 * x)]
}

deceptive_sample = {
    "name": "Deceptive",
    "X": HilbertCurveSampler(sample_size=100, dim=1, l_bound=0, u_bound=6),
    "F": lambda x: (0.4 * x - 2) ** 2 if x > 0.625 else (10 * x - 4) ** 2 - 2,
    "V": lambda x: ((0.4 * x - 2) ** 2 if x > 0.625 else (10 * x - 4) ** 2 - 2) - 1
}

load_data(sphere_sample)
load_data(deceptive_sample)
WARNING:root:The Hilbert curve with dimension 1 is just a number line. You are sampling around points on a number line.
WARNING:root:The Hilbert curve with dimension 1 is just a number line. You are sampling around points on a number line.
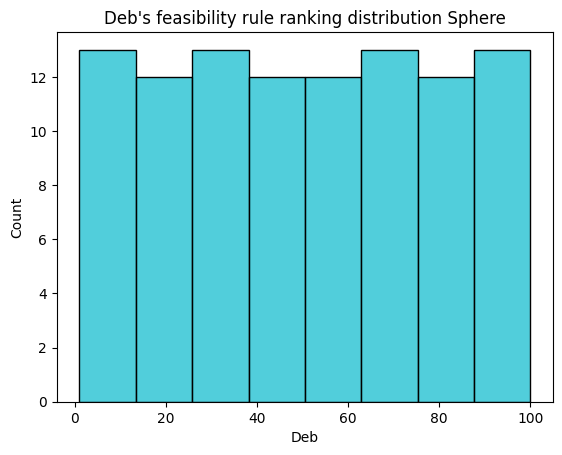
distr_Deb(sphere_sample)
({'Deb_min': 1,
  'Deb_max': 100,
  'Deb_mean': 50.5,
  'Deb_med': 50.5,
  'Deb_q1': 25.25,
  'Deb_q3': 75.75,
  'Deb_sd': 29.011491975882016,
  'Deb_skew': 0.0,
  'Deb_kurt': -1.2002400240024003},
 <Axes: title={'center': "Deb's feasibility rule ranking distribution Sphere"}, xlabel='Deb', ylabel='Count'>)
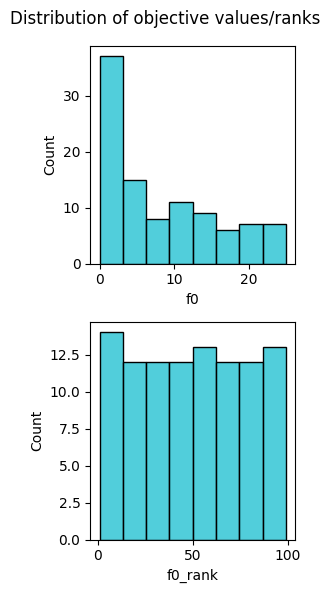
distr_f(sphere_sample)
({'f0_min': 0.001489075887394326,
  'f0_max': 25.0,
  'f0_mean': 8.306602377756104,
  'f0_med': 5.810982892827974,
  'f0_q1': 1.4835743521448939,
  'f0_q3': 13.953228429920058,
  'f0_sd': 7.631777799225109,
  'f0_skew': 0.6779687948562939,
  'f0_kurt': -0.79031951272523,
  'f0_rank_min': 1,
  'f0_rank_max': 99,
  'f0_rank_mean': 49.51,
  'f0_rank_med': 49.5,
  'f0_rank_q1': 24.25,
  'f0_rank_q3': 74.75,
  'f0_rank_sd': 28.99442475143569,
  'f0_rank_skew': 0.0019601813945263774,
  'f0_rank_kurt': -1.2027967085759266},
 <Figure size 300x600 with 2 Axes>)
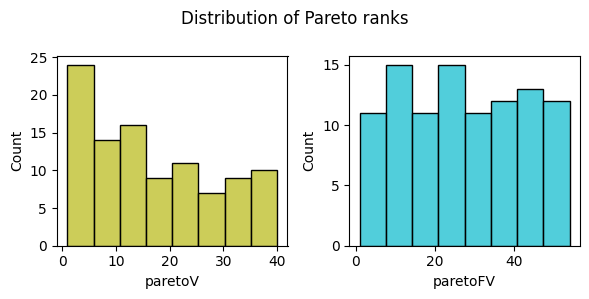
distr_Par(sphere_sample)
({'paretoV_min': 1,
  'paretoV_max': 40,
  'paretoV_mean': 16.5,
  'paretoV_med': 14.0,
  'paretoV_q1': 6.0,
  'paretoV_q3': 26.75,
  'paretoV_sd': 12.132683965307107,
  'paretoV_skew': 0.36083900012368475,
  'paretoV_kurt': -1.092331393135496,
  'paretoFV_min': 1,
  'paretoFV_max': 54,
  'paretoFV_mean': 27.33,
  'paretoFV_med': 26.5,
  'paretoFV_q1': 14.0,
  'paretoFV_q3': 40.75,
  'paretoFV_sd': 15.446914634229442,
  'paretoFV_skew': 0.04168327649182093,
  'paretoFV_kurt': -1.1827672534307703},
 <Figure size 600x300 with 2 Axes>)
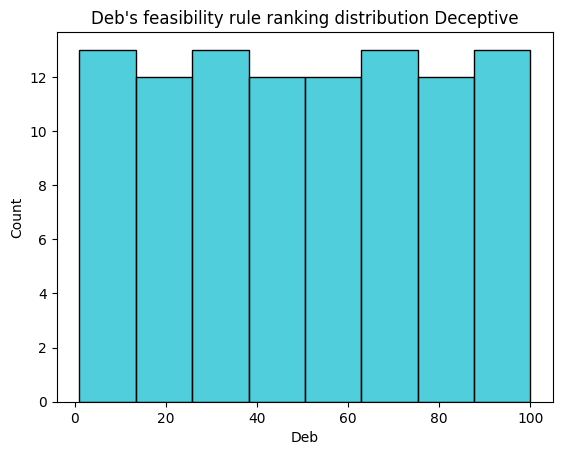
distr_Deb(deceptive_sample)
({'Deb_min': 1,
  'Deb_max': 100,
  'Deb_mean': 50.5,
  'Deb_med': 50.5,
  'Deb_q1': 25.25,
  'Deb_q3': 75.75,
  'Deb_sd': 29.011491975882016,
  'Deb_skew': 0.0,
  'Deb_kurt': -1.2002400240024003},
 <Axes: title={'center': "Deb's feasibility rule ranking distribution Deceptive"}, xlabel='Deb', ylabel='Count'>)
Knapsack instances
%cd ../../..
/home/toni/Projects/pyxla-wg/docs
easy_kp = load_sample('easy_kp')
hard_kp = load_sample('hard_kp')
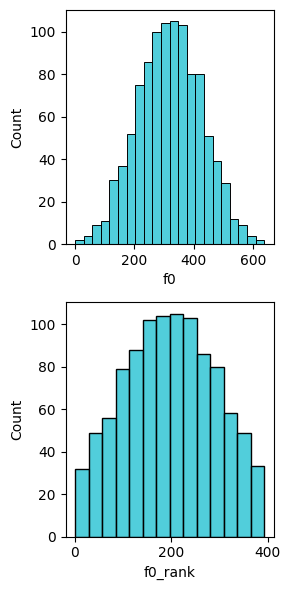
feat, plot = distr_f(easy_kp, title=False)
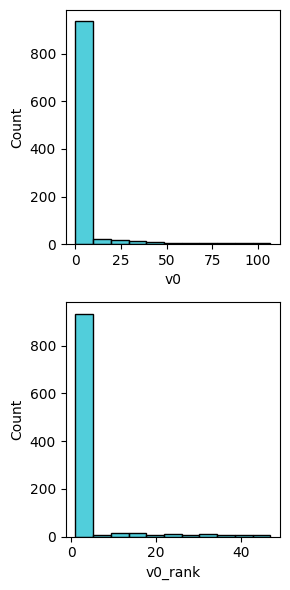
feat, plot = distr_v(easy_kp, title=False)
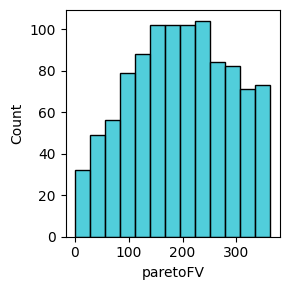
feat, plot = distr_Par(easy_kp, title=False)
feat, plot = distr_Deb(easy_kp, title=False)
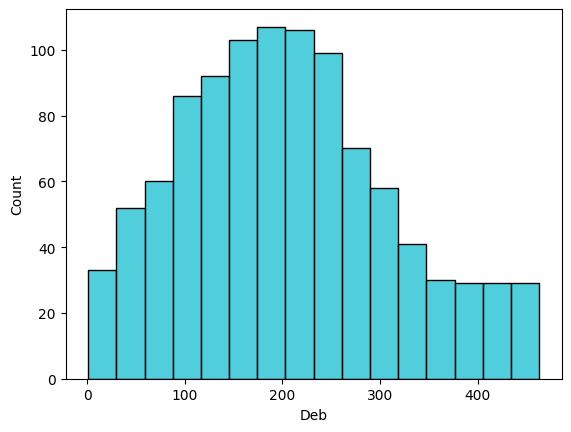
feat, plot = distr_f(hard_kp, title=False)
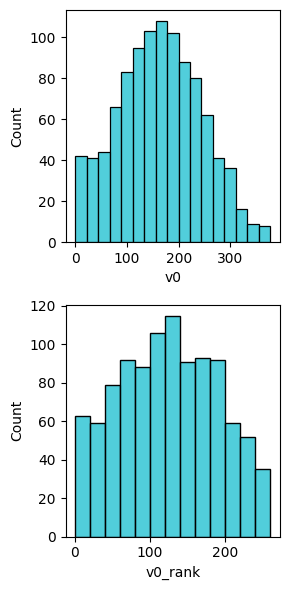
feat, plot = distr_v(hard_kp, title=False)
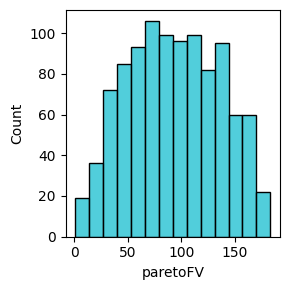
feat, plot = distr_Par(hard_kp, title=False)
feat, plot = distr_Deb(hard_kp, title=False)